LVA Software
Longwall Visual Analysis (LVA) is a powerful software solution for monitoring, visualising, analysing, and reporting critical longwall data. Developed since 2016 and now deployed on nearly all Australian longwalls, LVA delivers real-time insights and comprehensive historical analysis to support safer and more productive operations.
Who uses LVA and why?
- Operators rely on LVA for real-time feedback on longwall pressures and face conditions.
- Geotechnical engineers value the long-term trends and 3D visualisation of load cycle data.
- Maintenance teams use LVA to identify poorly performing supports and hydraulic issues.
- Managers appreciate the high-level summaries, production snapshots, and daily alert emails for quick situational awareness.
Operating Modes
- Live Mode – Real-time display of longwall conditions.
- Historical Mode – Explore past data to identify trends and investigate events.
- Multi-user Access – Any number of users can view LVA data live on desktop or laptop.
- Web Browser Access – Selected LVA views available via secure browser link.
- Server/User/Viewer Modes – Control user permissions for layout and settings management.
Key Features
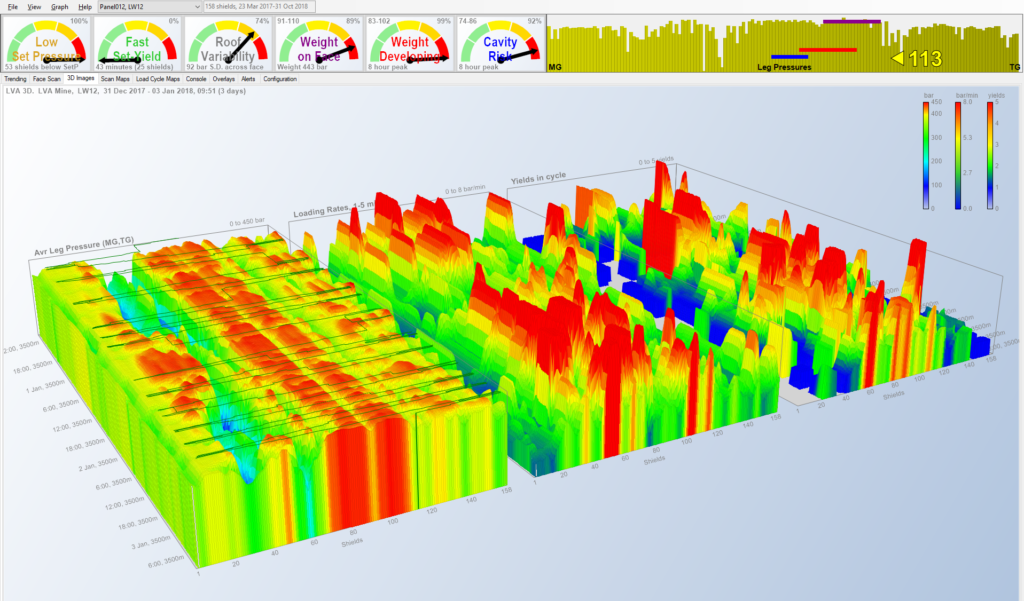
- Live Visualisation
- 2D and 3D displays of leg pressures, system pump pressure, shearer location, DA ram, LAS cycles, pitch/roll angles, floor deformation, gas data, shield heights (if instrumented), and top coal caving (if applicable).
- Advanced Analytics
- Trend analysis of leaking legs, calibration issues, yield counts, set-to-roof cycles, loading rates, cycle durations, TWAP (Time-Weighted Average Pressure).
- Load cycle maps show per-shear data across full panels (TWAP, yielding, low pressures, leaking, durations).
- Smart Alerting System
- Real-time monitoring for operational risks, including cavity formation and weighting events.
- Email alerts and daily snapshots delivered with relevant images and data insights.
- Integration & Access
- Automatic chainage import from spreadsheets.
- Data displayed by time or chainage.
- Longwall data can be overlaid on AutoCAD mine plans.
- Live Weblink feature allows remote access to key LVA images.
Displays & Analysis Tools
- 2D and 3D images for visualising current and historical status.
- Automated identification of set-to-roof cycles, shearer passes, yield events, calibration drift, and leg leaks.
- Configurable gauges and indicators to detect early warning signs of roof instability or poor support performance.
- Comprehensive reporting and export options:
- Save images or export graph data to tables.
- Overlay longwall metrics on mine layouts for context.
- Visualise full-panel shear data for rapid pattern recognition.